Radeon Memory Visualizer and GPU Profiler for non-developers
AMD has a set of tools aimed at developers to help them optimize their code to run efficiently on Radeon graphics cards. Those tools like Radeon Memory Visualizer and Radeon GPU Profiler can also be used by gamers and reviewers to check how their hardware is behaving and what is the actual resource usage.
Radeon Memory Visualizer
Radeon Memory Visualizer or RMV for short is an application aimed at optimizing GPU memory usage. We can use this application to check how a game uses system and GPU memory for assets and data:
- Check for actual memory usage
- Check if a game handles memory allocation efficiently (like when there is less than optimal amount of VRAM)
- Check for memory leaks (when debugging a game)
- Provide a dump file for a game developer to help fix and pin point bugs
Memory allocation and data management is a complex topic, and I'll try to cover some basics. In an ideal case scenario a game would use less VRAM than the GPU has available. RMV would not display any warnings and you would see that the used memory is below the limit.
When a game starts requesting more it may run into oversubscription problems where it wants to oversubscribe GPU memory with more data that can fit in. Depending on GPU arch and type of API used this can led to mapping data in your system RAM for use by GPU workloads. This is less efficient as whenever the asset would be needed it would have to be sent to the GPU. For a high framerate game this could lead to for example stutters or high I/O activity over the PCIe. RMV will warn if oversubscription can happen or is happening.
Other issues could be excessive heap allocations when a game allocates resources to aggressively and is being bit wasteful with VRAM. And when there isn't enough VRAM left some resource can be paged in/out between VRAM and system RAM causing some performance drops, flukes at seemingly random times.
How to use RMV?
To use RMV you will need RX 400, R9 Fury or newer Radeon graphics cards or APU. It works with DX12 or Vulkan games only and requires Windows 10. Download RMV and pick a DX12/Vulkan game to test it on.
To capture a log you have to:
- Launch RadeonDeveloperPanel.exe
- Under
System
tab add the executable of the games, applications you want to log.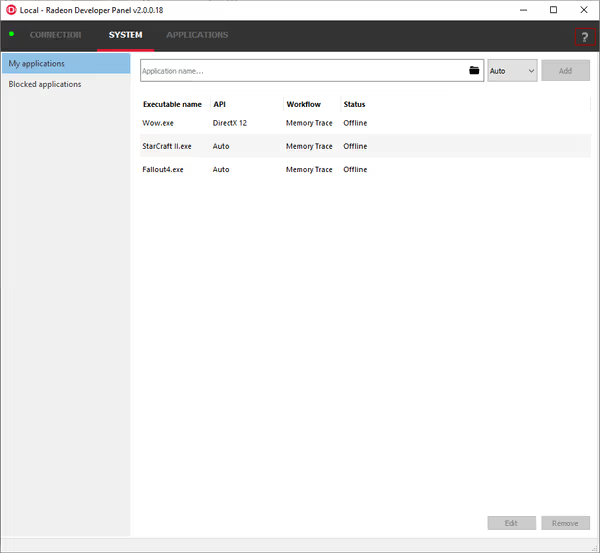
List of applications to trace. It won't work on DX11/9 games. - Check if
Connection
tab is green/connected and if not make it connect to it local server. - While the application is running launch the game.
- You should see an overlay in top left corner of the screen.
- The RMV Tracing option displayed in the overlay must be
Active
. If it's not then either the game isn't using a supported API or there is some other issue, old driver etc.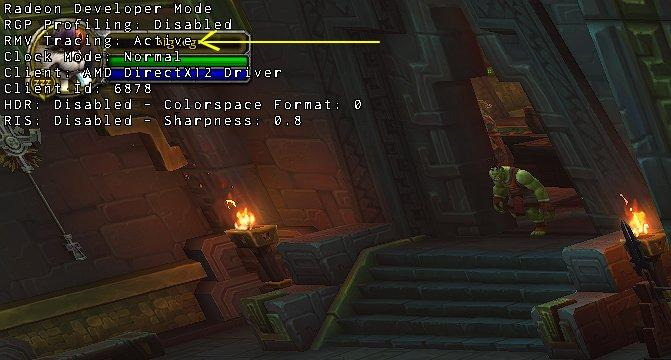
RMV tracing enabled successfully
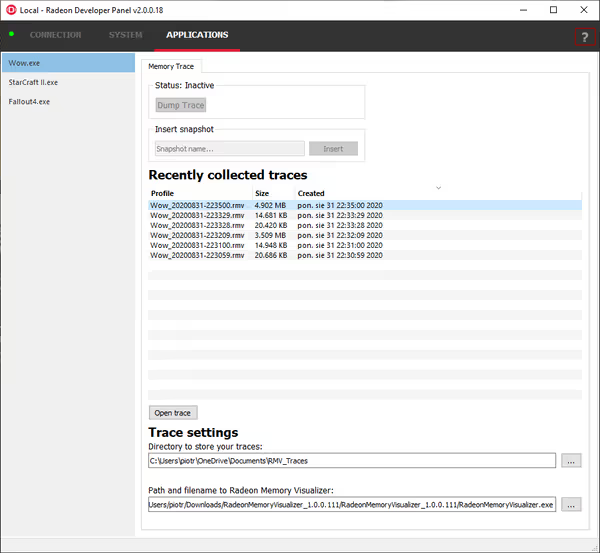
If active RMV will constantly log data so you can play your scene, run a benchmark or do an action that gave you performance problems. Exit the game and check Radeon Developer Panel for a trace file. Double click it to open the analysis app.
Now you can browse through the trace file in RMV application:
- RMV can open trace files and display recorded timeline. Right click at select point on the timeline to add a
snapshot
.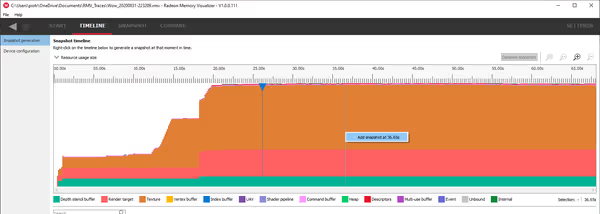
Creating snapshots on a timeline - You can select a snapshot to see it details on memory usage. You can select two snapshots to compare them.
- For non-developers the most interesting will be the
Heap overview
panel of a snapshot - it lists usage of all heaps of memory and potentially display warnings if something is not quite right.
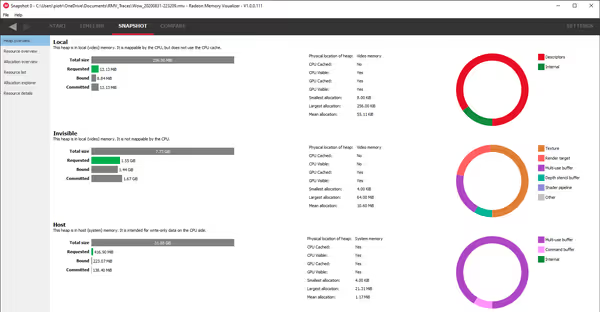
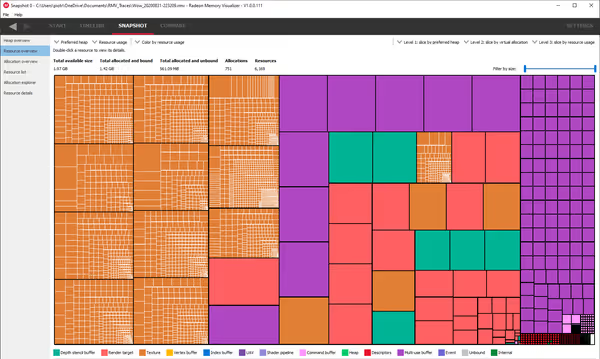
You can find more info about this tool in the docs.
Radeon GPU Profiler
Radeon GPU Profiler or RGP for short is an application that offers a very low level view of GPU activity during a frame lifecycle. You can check GPU utilization (and wherever the profiled game is CPU or GPU bound) as well as GPU workload flow and type (like wavefront occupancy, context rolls, command buffers, queues and more).
For a non-developer this application be used to:
- Check wherever given frame is GPU or CPU bound.
- Utilization, resource usage of the GPU.
- Provide a dump file for a game developer to help fix and pin point bugs, performance problems.
How to use RGP?
To use RGP you will need RX 400, R9 Fury or newer graphics cards or APU. It works with DX12 or Vulkan games only (plus OpenCL compute code). Download RGP and pick a DX12/Vulkan game to test it on. Where as RMV records a timeline RGP can drop a trace file for a batch of frames.
To capture profile logs:
- Launch RadeonDeveloperPanel.exe
- Check if
Connection
tab is green/connected and if not make it connect to it local server.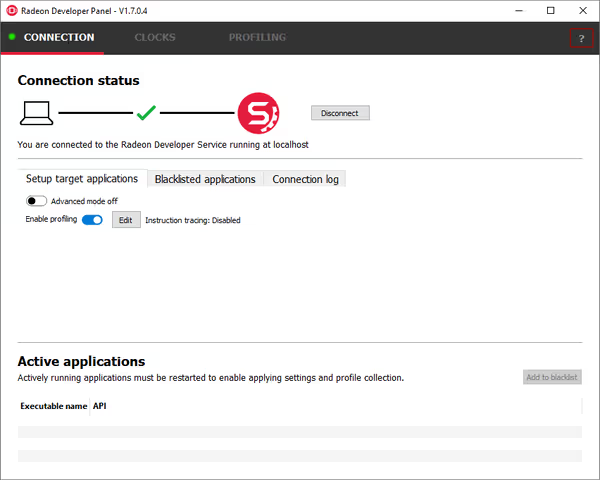
Connect to RGP server before starting to profile games - While the application is running launch the game.
- You should see an overlay in top left corner of the screen.
- To capture a profile press Ctrl+Shift+C - when you are at interesting part of a benchmark or when trying to debug a problem.
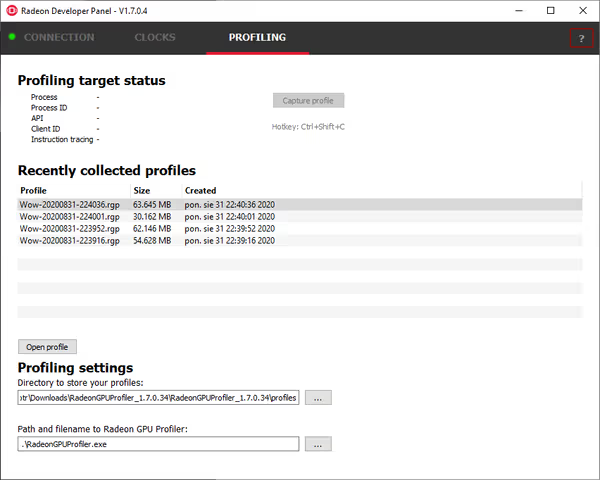
Close the game and go through captured profile files. Double click selected to open the RGP application.
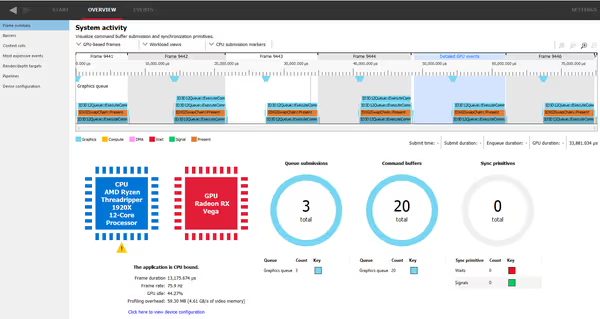
For non-developers the most interesting will be the Frame Summary
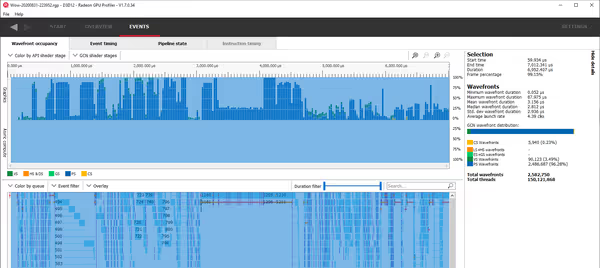
tab showcasing the bottleneck and overall GPU utilization information. If you want to compare frames you can go to the Events
tab to see how much threads and wavefronts were run. If you want to check if lower FPS in some spot of the game is caused by proportionally higher amount of GPU tasks then this metric will be higher.
If you are planning GPU/CPU upgrade and you want to use this to see what is your bottleneck be careful how you test. If you have Freesync or just frame limiter limiting the FPS to your display refresh rate then your GPU and CPU will have less work to do and there won't be a hard bottleneck when the FPS is hitting the cap. Keep those settings and capture frames when your system drops FPS below the cap. Also note that the result will be valid only for given game, given settings and given spot in the game. Other games can behave differently but if you test multiple games with same result then it should be more credible when thinking about an upgrade.

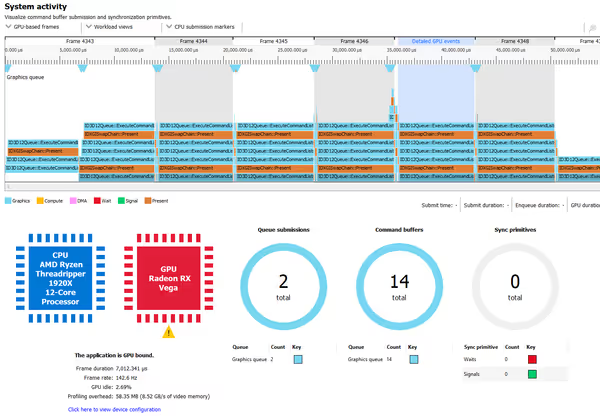
Those apps can be used when trying to debug problems in games. To either check if anything changes on GPU side or not and if so you can provide those files to help developers fixing the problem if needed.
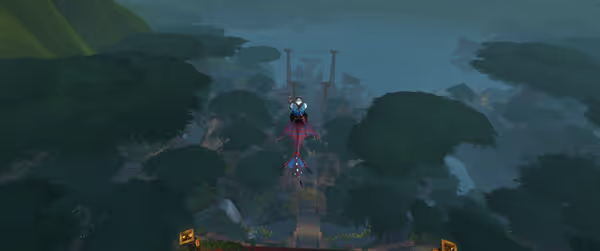
As an example - in WoW BfA after a mini patch a regression returned in Rustbolt city
where framerate would drop for many players. As a reference I had 104.7 FPS Average FPS and 87.6 FPS 1% low in Great Seal (quite expensive to compute) while much simpler Rustbolt had 56.9 FPS AVG and 51.3 FPS 1% low. RGP showed that even in Rustbolt GPU was 42% idle but the amount of shaded pixels, wavefronts, threads doubled versus Great Seal. Something was clearly going with the game (and have been fixed thereafter).
For Nvidia users there is Nsight Systems and Nsight Graphics application serving similar purpose. I'll try to go over them in a separate article.
Comment article