System and game performance monitoring with Python
Basic performance metrics are easy to get, but to get more precise data, like game performance metrics, low-level specialized software is required. On Windows, we have RTSS server and MSI Afterburner or Intel PresentMon, while on Linux, MangoHud takes their place.
Scripting languages like Python usually have libraries to get the basic system metrics. To get game or GPU performance metrics, we have to integrate existing acquisition software with the scripting language.
System metrics
psutil
For Python, the main library for system metrics and information is psutil. It's a cross-platform library, and lots of software is based on it.
You can get basic CPU information, frequency, and load, either current or within a given interval:
import psutil


print('- Logical core count', psutil.cpu_count())
print('- Physical core count', psutil.cpu_count(logical=True))
print('- Load AVG', psutil.getloadavg())

print('- CPU load percent: ', psutil.cpu_percent(interval=1))
print('- Core load percent: ', psutil.cpu_percent(interval=1, percpu=True))
print('- CPU FREQUENCY:', psutil.cpu_freq())
print('- Core FREQUENCY:', psutil.cpu_freq(percpu=True))
Which can give an output like so:
- Logical core count 16
- Physical core count 16
- Load AVG (0.4501953125, 0.47607421875, 0.5029296875)
- CPU load percent:  0.8
- Core load percent:  [0.0, 5.9, 2.0, 6.0, 1.0, 10.1, 1.0, 0.0, 1.0, 0.0, 3.0, 0.0, 1.0, 0.0, 3.0, 2.0]
- CPU FREQUENCY: scpufreq(current=794.1490625, min=400.0, max=4425.0)
- Core FREQUENCY: [scpufreq(current=1619.559, min=400.0, max=5100.0), scpufreq(current=400.0, min=400.0, max=5100.0), scpufreq(current=1785.265, min=400.0, max=5100.0), scpufreq(current=400.0, min=400.0, max=5100.0), scpufreq(current=1800.0, min=400.0, max=5100.0), scpufreq(current=1294.717, min=400.0, max=5100.0), scpufreq(current=400.0, min=400.0, max=4400.0), scpufreq(current=4331.828, min=400.0, max=4400.0), scpufreq(current=400.0, min=400.0, max=4400.0), scpufreq(current=400.0, min=400.0, max=4400.0), scpufreq(current=400.0, min=400.0, max=4400.0), scpufreq(current=1483.715, min=400.0, max=4400.0), scpufreq(current=400.0, min=400.0, max=4400.0), scpufreq(current=400.0, min=400.0, max=4400.0), scpufreq(current=400.0, min=400.0, max=2500.0), scpufreq(current=400.0, min=400.0, max=2500.0)]
You can get detailed I/O metrics of your storage:
import psutil
print('- Disk I/O counter', psutil.disk_io_counters(perdisk=False))
print('- Disks I/O counters', psutil.disk_io_counters(perdisk=True))
print('- Partitions', psutil.disk_partitions())
print('- Partition / usage', psutil.disk_usage('/'))
Disk usage/size is in bytes, for example:
- Partition / usage sdiskusage(total=97828376576, used=86693289984, free=6118334464, percent=93.4)Same thing for network interfaces:
import psutil

print('- Network I/O counters', psutil.net_io_counters(pernic=True))
print('- TCP connections', psutil.net_connections(kind='tcp'))
print('- Interfaces', psutil.net_if_addrs())
print('- Interface statuses', psutil.net_if_stats())
Memory usage:
import psutil

print('- SWAP', psutil.swap_memory())
print('- Virtual memory', psutil.virtual_memory())
- SWAP sswap(total=8589930496, used=0, free=8589930496, percent=0.0, sin=0, sout=0)
- Virtual memory svmem(total=134530617344, available=118858498048, percent=11.6, used=15672119296, free=111129923584, active=14708101120, inactive=6065545216, buffers=488738816, cached=8769470464, shared=1492008960, slab=831774720)Some systems (like laptops) will also offer access to basic sensor data:
import psutil

print('- Temperatures', psutil.sensors_temperatures())
print('- Fans', psutil.sensors_fans())
print('- Battery', psutil.sensors_battery())
If sensors aren't present or supported, the functions will raise an exception.
py-cpuinfo
py-cpuinfo as the name suggests offers full CPU information:
import pprint

from cpuinfo import get_cpu_info

pprint.pprint(get_cpu_info())
{'arch': 'X86_64',
'arch_string_raw': 'x86_64',
'bits': 64,
'brand_raw': 'Intel(R) Core(TM) Ultra 7 255H',
'count': 16,
'cpuinfo_version': [9, 0, 0],
'cpuinfo_version_string': '9.0.0',
'family': 6,
'flags': [...],
'hz_actual': [1700000000, 0],
'hz_actual_friendly': '1.7000 GHz',
'hz_advertised': [1700000000, 0],
'hz_advertised_friendly': '1.7000 GHz',
'l2_cache_associativity': 8,
'l2_cache_line_size': 4096,
'l2_cache_size': 65536,
'l3_cache_size': 25165824,
'model': 197,
'python_version': '3.13.7.final.0 (64 bit)',
'stepping': 2,
'vendor_id_raw': 'GenuineIntel'}platform module
The built-in platform module offers some basic system information as well:
import platform

print('- Machine', platform.machine())
print('- Platform', platform.platform())
print('- CPU', platform.processor())
print('- System', platform.system())
print('- Version', platform.version())
print('- uname', platform.uname())
print('- Win ver', platform.win32_ver())
print('- Win edition', platform.win32_edition())
print('- macOS ver', platform.mac_ver())
print('- iOS ver', platform.ios_ver())
print('- Freedesktop', platform.freedesktop_os_release())
print('- Android', platform.android_ver())
OS specific methods are functional under the given OS and will raise an exception when unsupported.
- Machine x86_64
- Platform Linux-6.17.0-35-generic-x86_64-with-glibc2.42
- CPU
- System Linux
- Version #35-Ubuntu SMP PREEMPT_DYNAMIC Tue May 26 13:10:28 UTC 2026
- uname uname_result(system='Linux', release='6.17.0-35-generic', machine='x86_64', ...)
- Win ver ('', '', '', '')
- Win edition None
- macOS ver ('', ('', '', ''), '')
- iOS ver IOSVersionInfo(system='', release='', model='', is_simulator=False)
- Freedesktop {'NAME': 'Ubuntu', 'ID': 'ubuntu', 'PRETTY_NAME': 'Ubuntu 25.10', 'VERSION_ID': '25.10', 'VERSION': '25.10 (Questing Quokka)', ...}
- Android AndroidVer(release='', api_level=0, manufacturer='', model='', device='', is_emulator=False)
plyer
plyer is a part of the Kivy project and offers access to various sensors and services of mostly Android and iOS with partial support for desktop systems.
import plyer


print('- Battery', plyer.battery.get_state())
print('- CPU', plyer.cpu.physical, plyer.cpu.logical, plyer.cpu.sockets)
print('- Device name', plyer.devicename.device_name)
- Battery {'isCharging': False, 'percentage': 98.0}
- CPU 16 16 1
- Device name some-linuxGlances
Glances is a full cross-platform monitoring tool based on psutil. It works as a stand-alone app, but can also be used as a Python library:
from glances import api


gl = api.GlancesAPI()
print(gl.cpu)
print(gl.gpu)
print(gl.sensors)
You can treat it as a high-level version of psutil, not to mention the additional functionality it can provide.
GPU metrics
There are vendor-specific tools to get GPU utilization and other metrics, and for Python, there are some dedicated libraries available.
AMD SMI offers an official Python library and you can also check pyamdgpuinfo. For Nvidia there are nvidia-ml-py binding for Nvidia NVML management library. Intel is a bit behind on such functionality.
Outside of Python you can also check radeontop, intel_gpu_top, umr, xdna-top and similar tools.
Game metrics
To get game performance metrics like FPS in Python, you will have to use an existing benchmarking application and parse its CSV pretty much. There are no direct bindings for RTSS or other applications.
- Windows: Intel PresentMon offers a CLI interface and CSV output, which can be parsed for full game metrics. Rivatuner Statistics Server, used by MSI Afterburner, can also be used by reading the metrics it stores in shared memory. On top of that, apps like GameBench, FRAPS, FrameView, or OCAT write data to disk, which then can be parsed with Python.
- Linux: MangoHud offers CSV output, and you can also read its stats from shared memory. Mesa-based drivers can also use Gallium HUD
- macOS: No good option to get game FPS on macOS. Games run by Wine/GamePortingToolkit can use Metal Performance HUD for the metrics whose output could be intercepted with Python. CoreDisplay or Quartz APIs accessed with pyobjc can give
screen refresh
metrics, which aren't real game FPS metrics. Built inpowermetrics
(with sudo) offers some utilization metrics. IOKit via pyobjc or metal-system-trace could also be used, but not for direct FPS metrics.
PresentMon
You will have to install Intel PresentMon and then play around with this script: presentmon-parser.py
You may have to adjust the version number (2.4.1/2.3.0/2.2.0 hardcoded). When launching the script, you will have to pass the game process name, which usually is the executable name, but if a game uses launchers, you may have to check the Windows process list how the final executable is called.
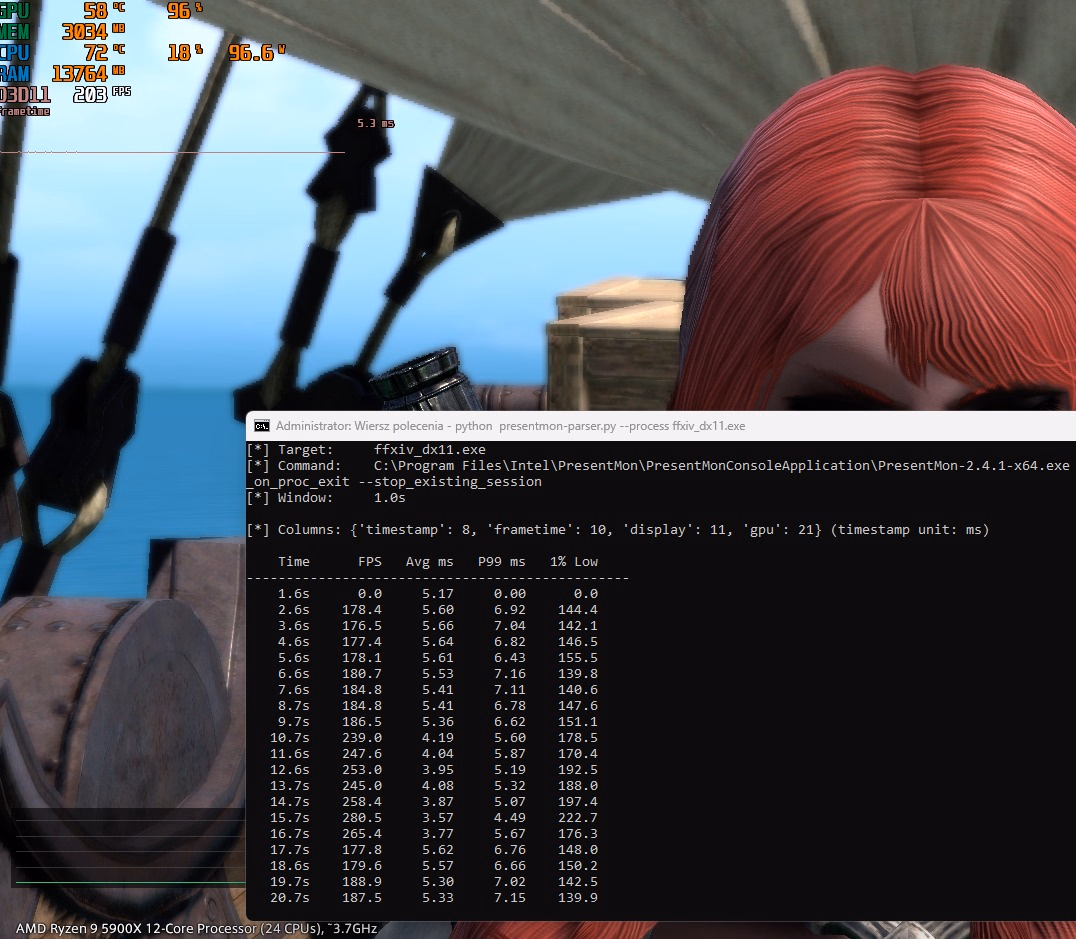
You will have to run Windows cmd
as administrator
mode and then execute the script.
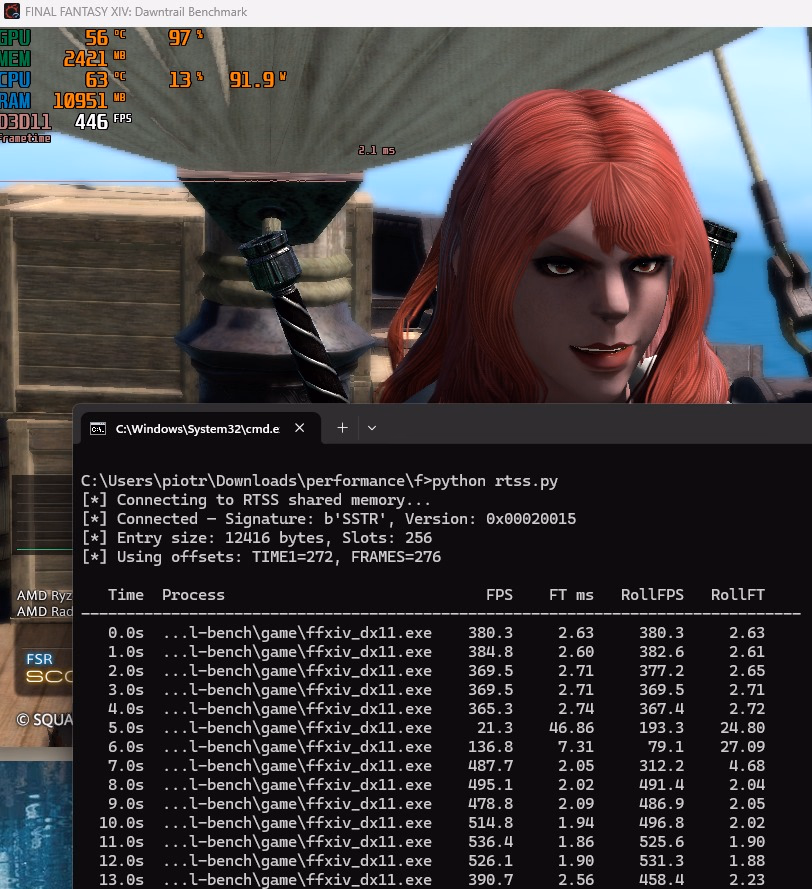
RTSS
Rivatuner Statistics Server stores metrics in shared memory. We can read them, and we don't have to know the process name. Assuming the game is running and RTSS is collecting metrics (like with the help of MSI Afterburner), we can get the data in Python.
To read the game FPS metrics use the rtss-sharedmem.py script.
MangoHud Linux
You will have to install MangoHud and then configure it so Steam uses it for a given game. Then configure it to generate a log CSV file that you later parse or run the script to watch for live log data. For benchmarking with MangoHud check christitus.com tutorial.
To parse MangoHud output use the mangohud-parser.py script.
Skyrim on Steam didn't want to cooperate with MangoHud, but Stardew Valley launched with the overlay and generated the log file using Steam Launch Options
like so:
Total samples:     3909
Est. duration:     67.0s

Avg FPS:           59.0
Median FPS:        60.0
Min FPS:           20.7
Max FPS:           477.5
Std Dev FPS:       10.0

Avg frame time:    17.13 ms
P95 frame time:    21.15 ms
P99 frame time:    22.31 ms
Max frame time:    48.31 ms

1% Low FPS:        44.8
0.1% Low FPS:      40.0

Avg CPU load:      3.9%
Avg GPU load:      23.8%
GPTK macOS
The game porting toolkit on macOS can generate a performance report that then you could parse. The report path is controlled by an env variable MTL_HUD_REPORT_URL, and you can read about it on developer.apple.com.
To read Apple plist
files you can use Python built-in plistlib module.
Summary
System metrics are easy to get. They can be used to make scripts displaying resource usage with whatever fancy UI. Fetching/parsing game benchmark data is possible, although not in an ideal way. It's doable for Windows and Linux, but it may be hard to create a fully automated benchmarking suite.
I'm going to try to use some less obvious UI to display the performance metrics - Raspberry Pi and addressable LEDs, analog dials, and a few other ideas.
Comment article